Charts will allow you to represent your data visually to explain and compare statistics. This article will show you how to add different types of charts to your scribe.
Top tip: Check out our blog post on adding and creating charts here.
Step 1. Add a chart and select the chart type
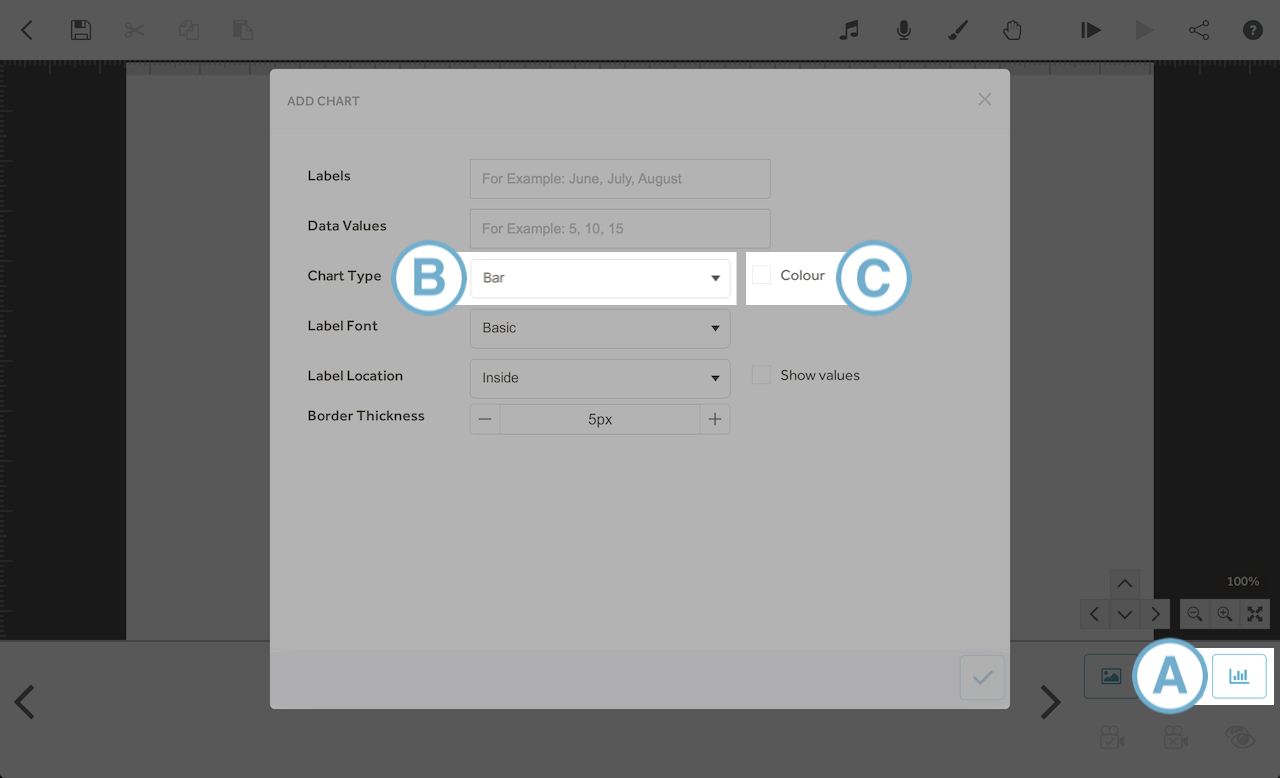
- To add a chart to your scribe click the Add New Chart icon (A) in the bottom right of the screen.
- There are 3 types of chart to choose from - line, pie and bar. You can change the chart type by selecting either Bar, Pie or Line from the dropdown menu (B).
- The chart can be displayed in color or as plain outlines by checking or unchecking the colour checkbox (C).
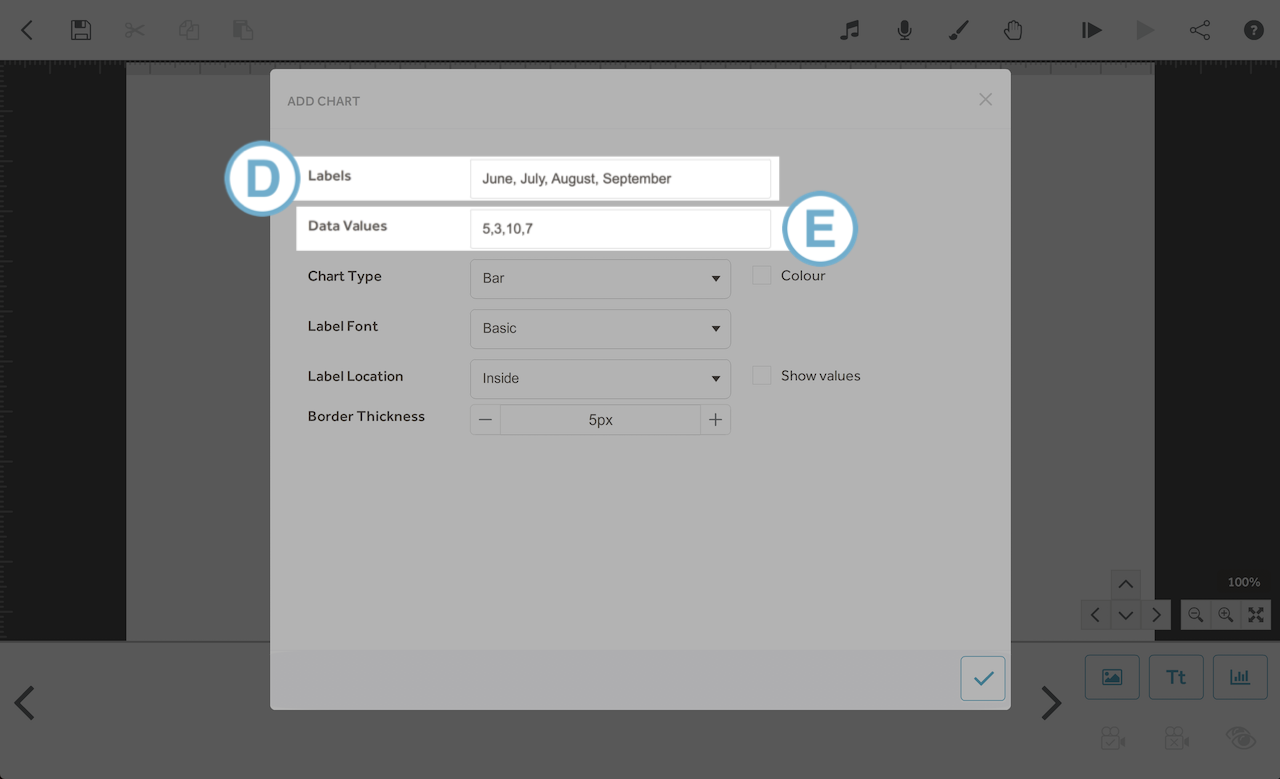
Step 2. Type in your labels and data values
- For each chart type you need to specify some Labels (D) and some Data Values (E).
- If you specify 4 labels, you should also specify 4 data values. Labels and data values must be separated by commas.
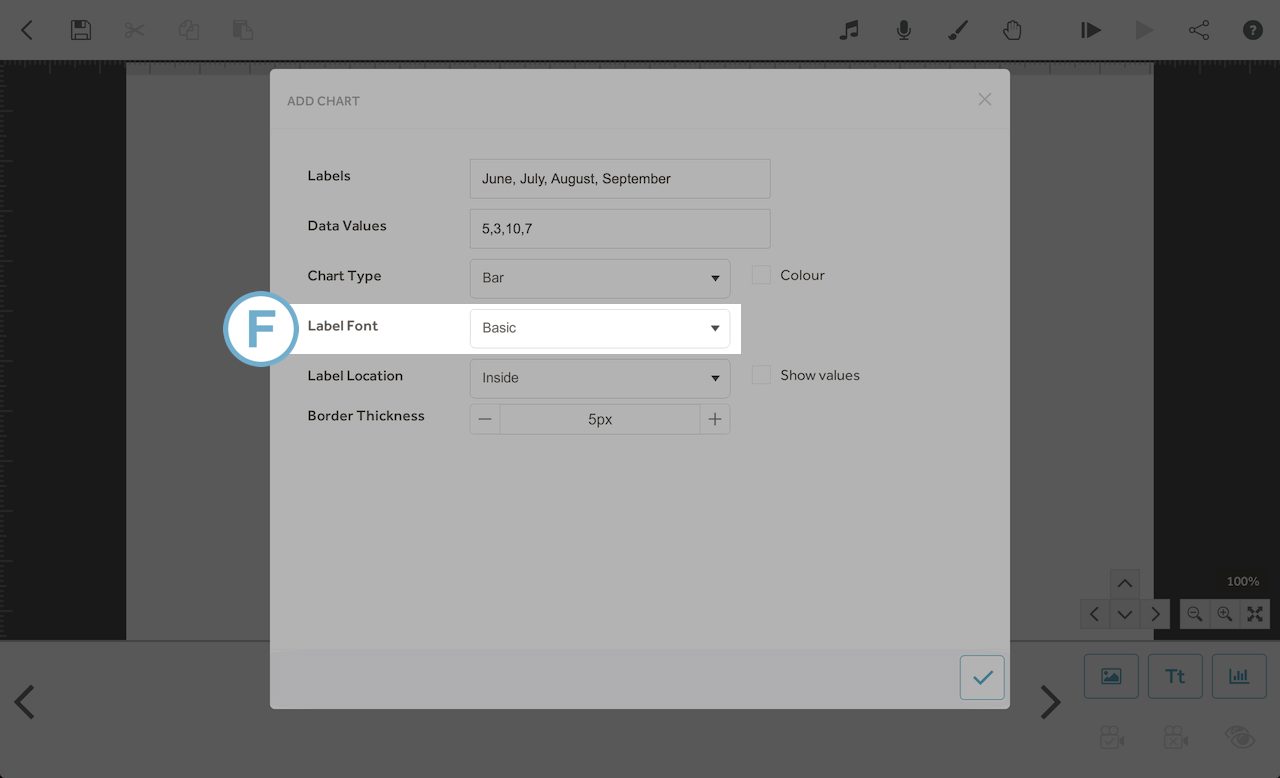
Step 3. Choose the label font
- The default font is ‘Basic’ and you can change this using the dropdown menu (F).
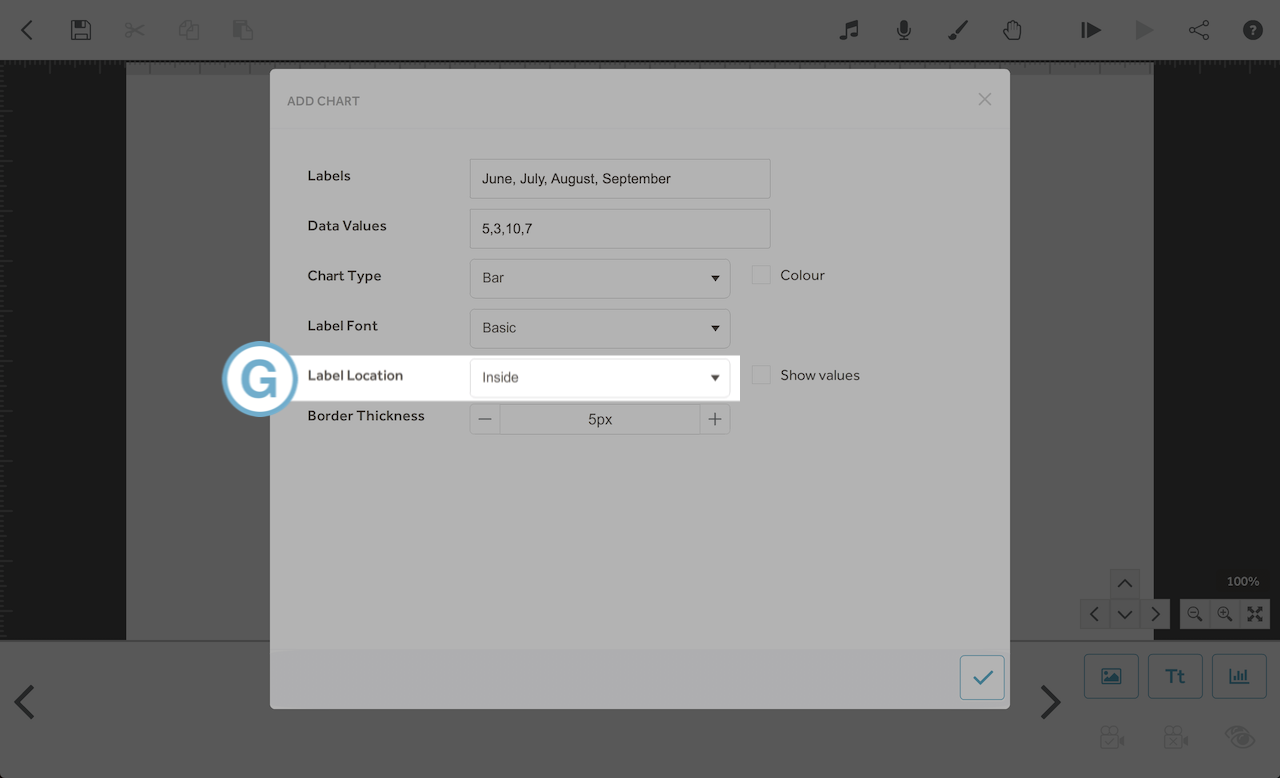
Step 4. Choose the label location
- You can choose the label location to be inside or outside the chart (G).
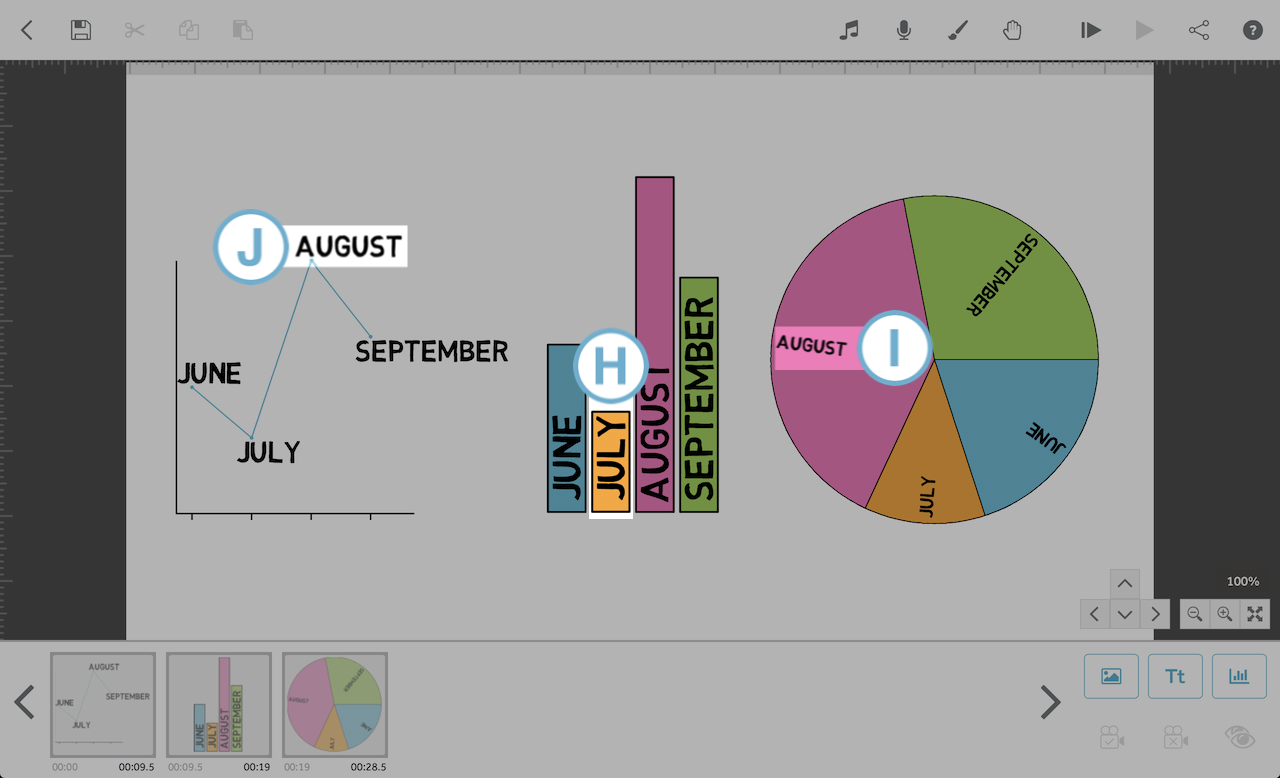
- When the label location is chosen to be inside the chart:
- For bar charts the labels will be inside the bars (H).
- For pie charts the labels will be inside each segment (I).
- For line charts the labels will be next to the line points (J).
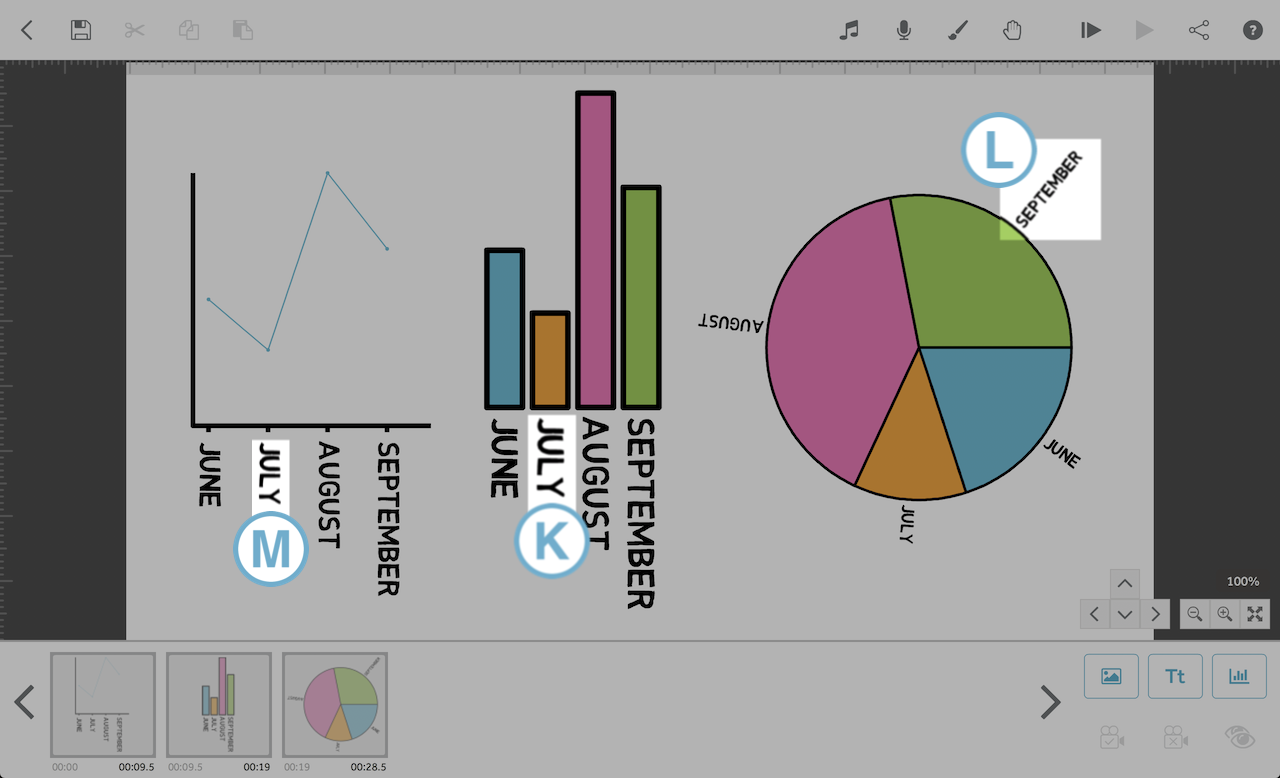
- When the label location is chosen to be outside the chart:
- For bar charts the labels will be below the bars (K).
- For pie charts the labels will be outside the corresponding segment (L).
- For line charts the label will be below the horizontal axis (the bottom line) (M).
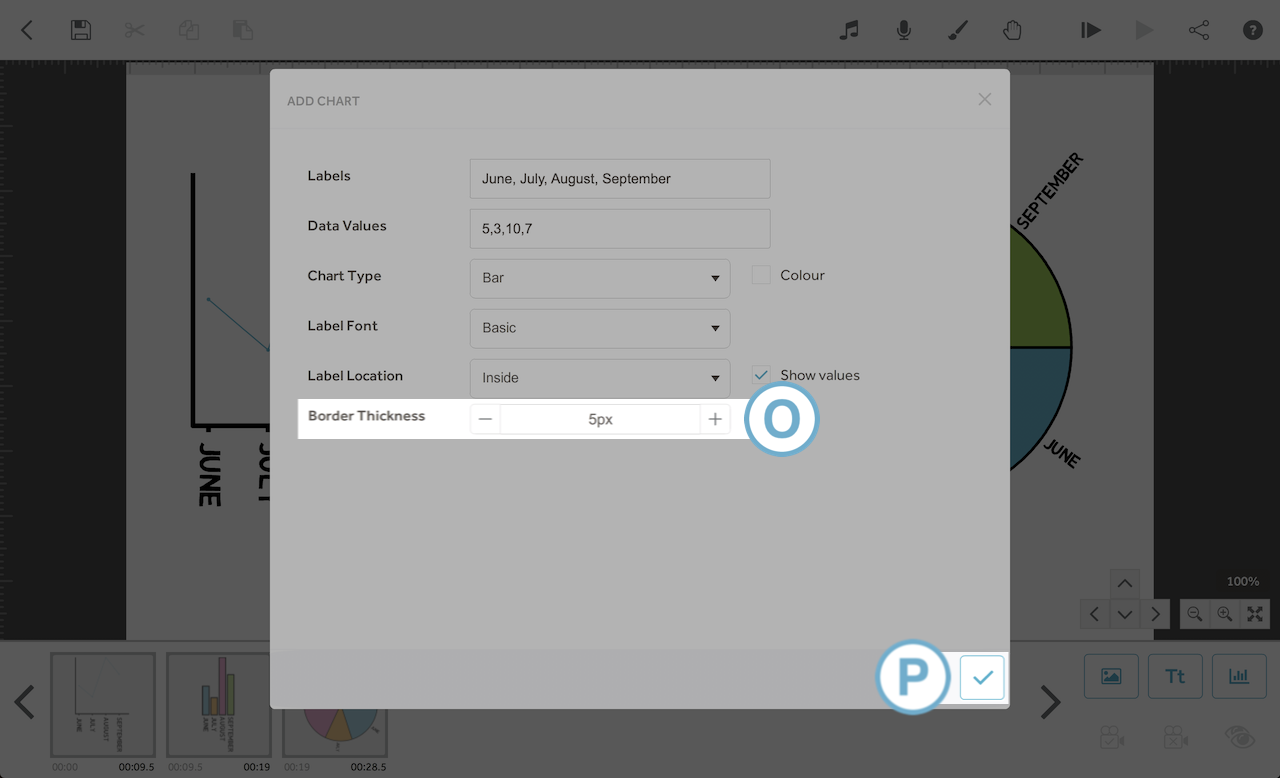
Step 5. Choose the border thickness of the chart and save
- Use the plus and minus icons (O) to increase and decrease the width of the chart borders.
- For bar charts this will affect the thickness of the lines around the bars.
- For pie charts this will affect the thickness of the outer circle and dividing lines.
- For line charts this will affect the thickness of the horizontal and vertical axes (the bottom and side lines).
- When you have finished click the tick (P) to save your chart and view it on the canvas.
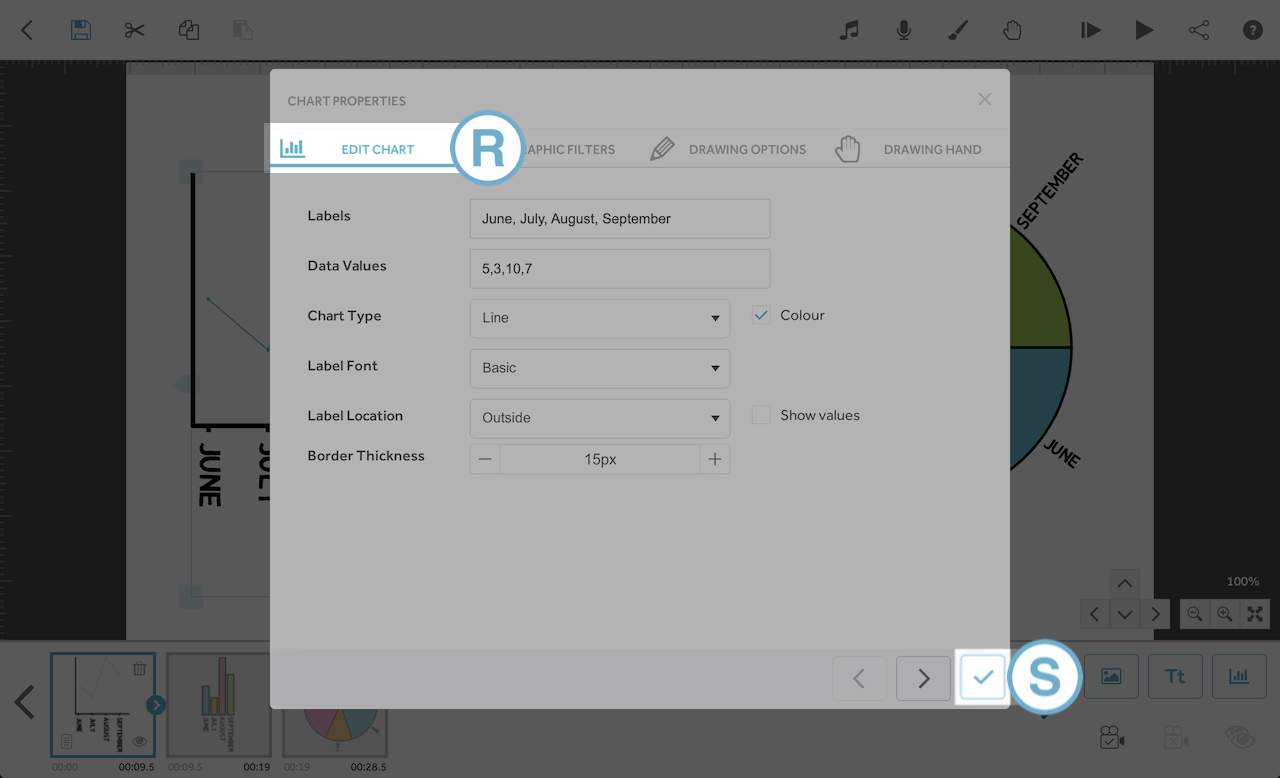
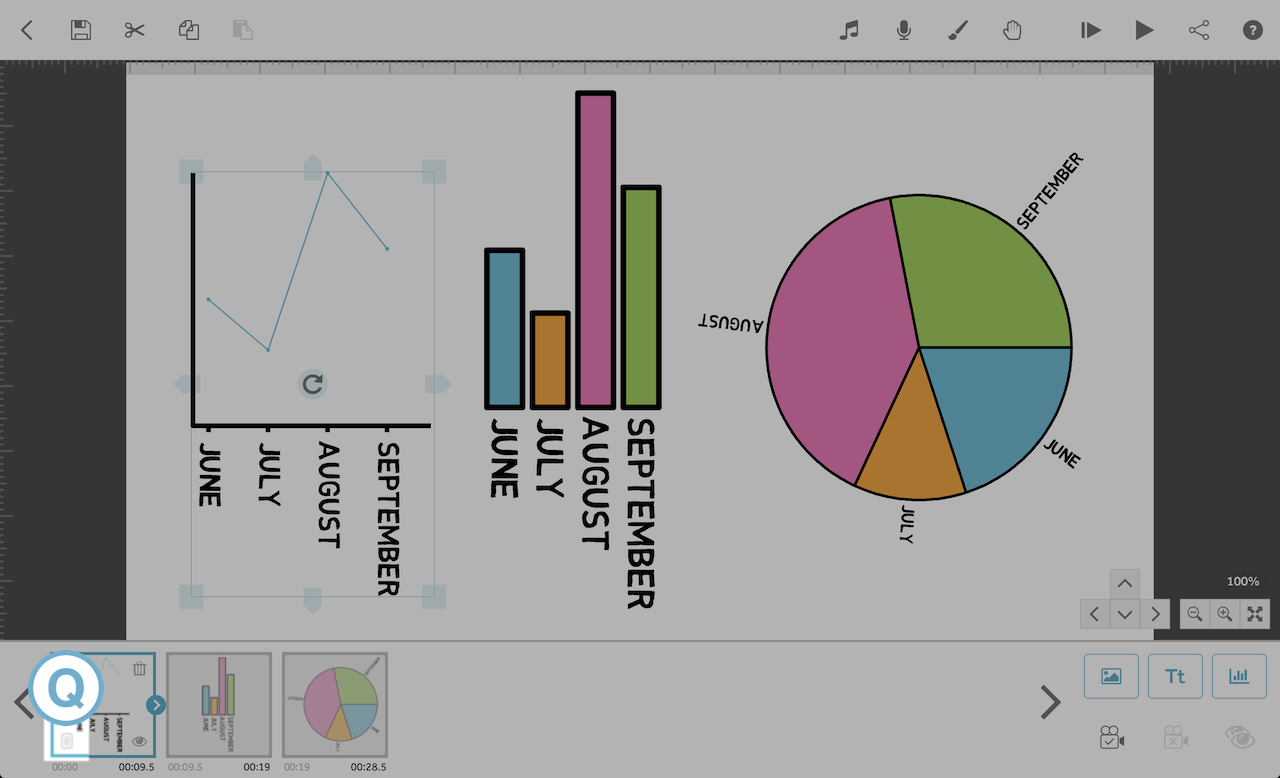
Step 6. Editing a chart
- If you need to change the chart you can do so in the chart’s properties.
- Open the chart’s properties by double clicking it on the canvas, or by double clicking it’s thumbnail in the timeline, or by clicking the properties icon on it’s thumbnail (Q).
- The properties can be edited (including changing the chart type) by choosing the ‘Edit Chart’ tab (R).
- When you have finished editing, click the tick icon (S) to confirm.